- Higher Education Statistics Agency (HESA) data shows that full-time enrolments for the academic year 2005-06 were 1,433,040 representing an increase in numbers of 3% since 2004/05. http://resources.kingsturge.com/
- Between 2004 and 2006 applications have risen 4.2% and acceptances increased 3.5%. http://resources.kingsturge.com/
- 36% of young people go to university. http://news.bbc.co.uk/
- Youngsters in the poorest areas are 30% more likely to go to university than they were five years ago. http://news.bbc.co.uk/
- Currently 40% of young women enter higher education, compared to just 32% of young men. http://news.bbc.co.uk/
- The number of new full-time undergraduates has increased by 9% across the UK since 2004 and 10% in England where the fees apply. http://www.guardian.co.uk/
- According to UCAS, universities have so far received 647,008 applications - 9,235 more than the previous year. If this rapid increase in applications continues, there will be 707,000 students trying for just 479,000 places. That leaves 31% of students without a place at university at all. http://www.studentbeans.com/
- If you want a job, you've already got an advantage if you have a degree- 89.9% of graduates either go on to employment or further study. http://www.guardian.co.uk/
- Best university city in the UK. Manchester 25.27%, Newcastle 21.51%, Leeds 18.82%, Nottingham 16.13%, Edinburgh 11.83%, Sheffield 11.29%, Cardiff 9.14% and St Andrews 2.15%. http://www.thestudentroom.co.uk/
- Universities with high rankings tend to have fewer dropouts, and fewer students per academic. The top 20 institutions have a drop-out rate after the first year of just 4%, compared with almost 12% for the bottom 20. http://www.guardian.co.uk/
- Demand for master's degrees was up 7.4%, and the number of PhD students grew 1%. http://www.guardian.co.uk/
- "At least 70% of what you get out of a master's is directly related to how much you put in," says Intriligator. http://www.guardian.co.uk/
- The Student Room website questioned 672 students about their future study plans and a third of them revealed that the planned rise in tuition fees would put them off postgraduate education. http://www.studentbeans.com/
- Lack of funding options for postgrad study was also cited, with over half of respondents indicating that as a major concern. http://www.studentbeans.com/
- A recent survey has revealed that 47% of sixth formers are planning to go straight into employment after their A-levels, while a further 12% were unsure yet of their plans. http://www.studentbeans.com/
- Of the 39% who are planning to go to university after A-levels, a fifth were worried about the cost of higher education, agreeing that it ‘caused them concern’. http://www.studentbeans.com/
- 22% of respondents who were planning to attend university said they felt ‘pressured’ to do so by friends and family. http://www.studentbeans.com/
- 71% of the sixth formers questioned did not have accurate knowledge of tuition fees, and could not say exactly how much they would be expected to pay. http://www.studentbeans.com/
- Over 70% of students claim that their parents have to help them pay for things because they’re a student. http://www.studentbeans.com/
- A massive 85% of parents said that they didn’t expect their child to pay them back and only one in ten said they would expect their child to pay back the full cost. http://www.studentbeans.com/
- Daughters were more likely to end up borrowing money but they were also more likely to feel guilty about their parents financial situation than sons were. http://www.studentbeans.com/
- More than half of graduates said they hoped to be able to pay their parents back. http://www.studentbeans.com/
- According to the Core Institute, an organization that surveys college drinking practices, 300,000 of today's college students will eventually die of alcohol-related causes such as drunk driving accidents, cirrhosis of the liver, various cancers and heart disease. http://www.factsontap.org/
- 159,000 of today's first- year college students will drop out of school next year for alcohol- or other drug-related reasons. http://www.factsontap.org/
- The average student spends about $900 on alcohol each year. Do you want to know how much cash the average student drops on his or her books? About $450. http://www.factsontap.org/
- Almost one-third of college students admit to having missed at least one class because of their alcohol or drug use. http://www.factsontap.org/
- One-quarter of students report bombing a test or project because of the aftereffects of drinking or doing drugs. http://www.factsontap.org/
- One night of heavy drinking can impair your ability to think abstractly for up to 30 days, limiting your ability to relate textbook reading to what your professor says. http://www.factsontap.org/
- Contrary to popular belief, beer in student bars is not subsidised. However, it is cheap. Sometimes it’s as little as a £1.40 a pint — even cheaper if there’s a promo. Other drinks are up to a third cheaper than local pubs too. http://push.co.uk/
- Unions reporting an 81% decline in profits over the past 5 years. The past year alone has seen a downturn of 8.3%, and closures have started, including the demise of Bristol Student's Union bar, shut in 2009. http://www.studentbeans.com/
-
The cheapest regular pint of beer at a student bar (not on a promo) is the University of Liverpool which charged £1.30. The most expensive was £3.15 at St Mary's University College, Twickenham.
- The average number of units drunk per student per week are shown in brackets. Leeds Metropolitan University (26.7) University of Liverpool (26.6) University of Wales Institute, Cardiff (26.1) Bath Spa University (24.9) University of Glamorgan (22.2) University of Bath (21.9) University of Brighton (21.9) Buckinghamshire New University (21.5) Newcastle University (21.2) De Montfort University (21.0) http://www.studentbeans.com/
- 2,197 of you completed our online Student Drinking Survey 2011, 4% of whom said they do not drink alcohol at all. 61% of all respondents said they regularly drink alcohol, whilst 35% admitted to doing so occasionally. http://www.studentbeans.com/
- Taste proves to be an important factor, with 62% of participants agreeing that this was the top reason and 67% agreeing that Vodka is the drink of choice. A greater number of students taking part in the survey however, agree that the number one reason to drink is to have fun on a night out. 54% said they have a drink to relax, while 38% admit to drinking alcohol because it makes them more confident. Of course, there’s always those society initiation ceremonies, which 22% of students said generally involves drinking alcohol. http://www.studentbeans.com/
- Alcohol is occasionally seen as a way of improving social life at university. 57% state that drinking helps you make friends at university, with one fifth of participants going as far as to say that they would not be able to survive a term at uni without drinking some form of alcohol.
- 47% admitting to being concerned about the long-term effects of drinking on their body. http://www.studentbeans.com/
- The results of the Student Drinking Survey 2011 showed that an overwhelming percentage of students drink at home as opposed to going out. Well, that, or both. It's generally the cheapest option to have a few at home before going off elsewhere and 82% saying they usually drink at home or at friends' houses during term-time. http://www.studentbeans.com/
- 67% think that there is a difference in the drinking habits between British and International students. http://www.studentbeans.com/
- 53% of students have missed a lecture or seminar because they drank too much the night before. http://www.studentbeans.com/
- 47% non-drinking students wish that alcohol wasn't such a big part of university life. http://www.studentbeans.com/
- Percent of adults 18 years of age and over who were current regular drinkers (at least 12 drinks in the past year): 50.9% http://www.cdc.gov/
- Students favourite drinks. Vodka 67%, Cider 45%, Beer 32%, Alcopops 29%, Rose 28%, White wine 25%. http://www.studentbeans.com/
- Alcohol percentage in alcopops 4-7% http://www.alcoholcontents.com/
- Alcohol percentage in cider 4-8% http://www.alcoholcontents.com/
- Alcohol percentage in general wine 10-15% http://www.alcoholcontents.com/
- Alcohol percentage in general spirits 40% http://www.alcoholcontents.com/
- Alcohol percentage in absinthe 55–89.5% http://www.alcoholcontents.com/
- Students after a night out. 59% experienced memory loss, 48% walked home alone, 37% didn't know how they got home, 33% been injured, 26% got into a taxi without knowing if it was licensed, 25% had a one night stand. http://www.studentbeans.com/
- Of all the questionnaire's participants, 25% admitted to having had a one-night stand under the influence of alcohol and 22% of students said that they have had a sexual encounter after drinking alcohol that they later regretted. http://www.studentbeans.com/
- The average number of sexual partners per student is shown in brackets. University of Glamorgan (10.9) University of Wales Institute, Cardiff (10.6) University of Brighton (9.5) Leeds Metropolitan University (9.4) Aberystwyth University (9.1) Manchester Metropolitan University (8.4) University of Dundee (8.2) University of Liverpool (8.1) University of Strathclyde (7.7) University College London (7.6) http://www.studentbeans.com/
- At some unis the cost of living is more than twice as much as at others. Last year Teesside was the cheapest and the Royal Academy of Music the most expensive. http://push.co.uk/
-
Studying in London is almost 50% more expensive than studying in Wales. http://push.co.uk/
-
By the time they graduate, the average debt of a student starting this Autumn is likely to be around £25,000.
-
Hundreds of thousands of pounds go unclaimed every year in bursaries, scholarships, prizes, all sorts.
-
Last year, students earned an average of around £3,000 doing part-time jobs and working in vacations.
-
Last year the Government spent £5 billion on student grants and loans. If they spent the same amount on Mars Bars, they could line them up on the equator and go round the earth two and a half times. http://push.co.uk/
- Young people struggling to repay their debts have been urged to get help as official figures reveal that 25- to 34-year-olds are the biggest users of debt relief orders (DROs), a form of insolvency introduced two years ago. http://www.guardian.co.uk/
- The Insolvency Service's figures show that over the last two years one in three people under 25 who were given a DRO owed less than £5,000, whereas all other age groups typically owed more. http://www.guardian.co.uk/
- Among the over 25s, 40% owed between £10,000 and the maximum allowable debt of £15,000. http://www.guardian.co.uk/
- According to the government it costs on average £10,980 a year to be a student. The NatWest student money survey puts it even higher - at £11,580. Either way, over three years it will cost you at least £33,000 to complete your degree. http://www.guardian.co.uk/
- Americans now owe more than $875 billion on student loans, which is more than the total amount that Americans owe on their credit cards. http://endoftheamericandream.com/
- Since 1982, the cost of medical care in the United States has gone up over 200%, which is horrific, but that is nothing compared to the cost of college tuition which has gone up by more than 400%. http://endoftheamericandream.com/
- The typical U.S. college student spends less than 30 hours a week on academics. http://endoftheamericandream.com/
- The unemployment rate for college graduates under the age of 25 is over 9%. http://endoftheamericandream.com/
- There are about two million recent college graduates that are currently unemployed. http://endoftheamericandream.com/
- Approximately two-thirds of all college students graduate with student loans. http://endoftheamericandream.com/
- In the United States today, 317,000 waiters and waitresses have college degrees.http://endoftheamericandream.com/
- The Project on Student Debt estimates that 206,000 Americans graduated from college with more than $40,000 in student loan debt during 2008. http://endoftheamericandream.com/
- In the United States today, 24.5% of all retail salespersons have a college degree. http://endoftheamericandream.com/
- Total student loan debt in the United States is now increasing at a rate of approximately $2,853.88 per second. http://endoftheamericandream.com/
- There are 365,000 cashiers in the United States today that have college degrees. http://endoftheamericandream.com/
- Starting salaries for college graduates across the United States are down in 2010. http://endoftheamericandream.com/
- In 1992, there were 5.1 million "underemployed" college graduates in the United States. In 2008, there were 17 million "underemployed" college graduates in the United States. http://endoftheamericandream.com/
- In the United States today, over 18,000 parking lot attendants have college degrees. http://endoftheamericandream.com/
- Federal statistics reveal that only 36% of the full-time students who began college in 2001 received a bachelor's degree within four years. http://endoftheamericandream.com/
- According to a recent survey by Twentysomething Inc., a staggering 85% of college seniors planned to move back home after graduation last May. http://endoftheamericandream.com/
- A study by MyMemory has discovered that the average British Facebook user is intoxicated in 76% of their tagged photos. http://www.studentbeans.com/
- 56% of people surveyed admitted that they had drunk photos that they wouldn’t want co-workers to see - while 8% admitted their photos could cause some serious trouble at work. http://www.studentbeans.com/
- 93% of respondents have apparently untagged photos after deeming them ‘too embarrassing.’ http://www.studentbeans.com/
- On Facebook the 18-24 (college) demographic grew the fastest at 74% in one year. http://www.digitalbuzzblog.com/
- About 83% of British 16 to 24-year-olds are thought to use social networking sites to keep in touch with friends and organise their social lives. http://www.telegraph.co.uk/
- 79% of Facebook-using students believed the time they spent on the site had no impact on their work. http://www.telegraph.co.uk/
- Students, how many people did you kiss in 2011? 0-1 47.79%, 2-3 19.85%, 4-5 9.56%, 6-7 8.09%, 8-9 2.21%, 10-11 4.41%, 12-13
0.74%, 14+ 7.35%. http://www.thestudentroom.co.uk/
- Students, how many hours of sleep do you get per day? 4 or less 1.10%, 5 6.04%, 6 18.68%, 7 24.18%, 8 26.92%, 9 12.64%, 10 4.95%, 11 3.30%, 12+ 2.20%. http://www.thestudentroom.co.uk/
- 92% of students said that they got worried during exam time. http://www.studentbeans.com/
- One fifth of students surveyed revealed that they had suffered anxiety attacks as a result of pre-exam stress. http://www.studentbeans.com/
- 61% questioned cited lack of sleep/insomnia as a result of stress, 51% said that they suffer from headaches or migraines and 47% admitted turning to the one of the world’s best comforts: food. http://www.studentbeans.com/
- Oxford has accepted 32 black students for undergraduate study this year, the highest number in 10 years, the university has disclosed. The acceptance rate for black students among this year's intake was 14%, an improvement on last year's admissions round, when 8.8% of black applicants were successful compared with 24.1% of white applicants. http://www.guardian.co.uk/
- The number of students taking British degrees overseas has overtaken the number of foreign students at UK universities, growing at least 70% within the last 10 years and last year a record number, 22,000, were studying for degrees abroad. http://www.studentbeans.com/
- From my survey 100% of students enjoy their life as a student.
- Best parts of student life. From my group 85% said studying a subject you're passionate about, social life received 75%, future prospects 70%, 60% chose freedom and 45% for a chance to move away from home.
- 45% of the students I questioned did have a parent that has been to university 55% did not.
- From my survey 75% lived in student halls, whereas 5% lived in rented accommodation and the other 20% lived at home.
- On average how often would you clean your living space? The students answered with weekly 40%, 30% for more than once a week, fortnightly 15%, 10% everyday and 5% monthly.
- 90% from my questionnaire had a student loan.
- 50% budgeted the amount they would spend.
- The most popular amount of money spent each week for my students was £25-£50 and £50-£75 with 30% each, £75-£100 25% and with 15% 0-£25.
- From my survey I found that 70% of people went out 2-3 times a week, 15% fortnightly, 10% monthly and 5% 3-4 times a week.
- From this 70% got drunk 1-2 times a week, 15% 3-4 times and never.
Tuesday, 27 December 2011
100 Statistics.
100 Words.
- Accents
- Accommodation
- Adapt
- Adventure
- Alcohol
- Arguments
- Bars
- Blur
- Budget
- Camera
- Careless
- Change
- Choices
- Clubs
- Cocktails
- Conversation
- Cooking
- Confusing
- Deadline
- Debt
- Different
- Dirty
- Drugs
- Drunk
- Emotional
- Essay
- Exciting
- Experience
- Family
- Fancy-dress
- Fast-food
- Finance
- Fun
- Freedom
- Friends
- Games
- Gossip
- Groups
- Hangover
- Holidays
- Home
- Homesick
- Independence
- Insecure
- Internet
- Jokes
- Laughing
- Laundry
- Learn
- Lecture
- Lie-ins
- Loan
- McDonalds
- Memories
- Mess
- Mistakes
- Money
- Music
- New
- Nightlife
- Oversleep
- Paraletic
- Party
- Personalities
- Phonecalls
- Photos
- Plans
- Pranks
- Pre-drinks
- Progress
- Pubs
- Regrets
- Relationships
- Relaxed
- Responsibility
- Seminar
- Sex
- Shopping
- Shots
- Sick
- Skills
- Sleep
- Spending
- Social
- Stress
- Study
- Surprising
- Tagged
- Taxi
- Texts
- Tired
- Trust
- Tutors
- Unexpected
- Vodka
- Walking
- Washing
- Workload
Sunday, 11 December 2011
How To... Self Evaluation.
What problem did you identify?
How to grow vegetables.
What evidence did you find to support your decisions?
Through our surveys it became clear that students were really interested in alcohol and were up for trying new things when it came to it. They also enjoyed drinking games and pre-drinkng at home.
What methods did you use to gather your evidence and what forms did it take?

What methods of research did you find useful and why?
I found all the research beneficial, especially the factual pieces. I also liked receiving the feedback from the primary forms as it was satisfying getting the information that you'd asked for or sought out.
How did these inform your response to your problem?
When we got our feedback from the questionnaire I feel that it pushed on our project the most as it backed up our idea that what we were creating would be good for our target audience.
What methods did you encounter as problematic?
Something that was problematic was finding out how long chillies take to grow, as a lot of the information we found on the internet was quite contrasting.
How did you overcome this?
To overcome this I sent emails to different people who had a lot of knowledge in the area. I was really happy when I got two responses.
What research could you have carried out that would have proved more useful?
If I could have done further research it would have been looking further into different ways of growing chillies.
How to grow vegetables.
What evidence did you find to support your decisions?
Through our surveys it became clear that students were really interested in alcohol and were up for trying new things when it came to it. They also enjoyed drinking games and pre-drinkng at home.
What methods did you use to gather your evidence and what forms did it take?
- Internet searching
- Questionnaire
- Emails

What methods of research did you find useful and why?
I found all the research beneficial, especially the factual pieces. I also liked receiving the feedback from the primary forms as it was satisfying getting the information that you'd asked for or sought out.
How did these inform your response to your problem?
When we got our feedback from the questionnaire I feel that it pushed on our project the most as it backed up our idea that what we were creating would be good for our target audience.
What methods did you encounter as problematic?
Something that was problematic was finding out how long chillies take to grow, as a lot of the information we found on the internet was quite contrasting.
How did you overcome this?
To overcome this I sent emails to different people who had a lot of knowledge in the area. I was really happy when I got two responses.
What research could you have carried out that would have proved more useful?
If I could have done further research it would have been looking further into different ways of growing chillies.
Friday, 9 December 2011
How To... Final Photo's.


Thursday, 8 December 2011
How To... Design Development.
As a group we decided to go with Ste's main design, here are some things that he put together...
 We really liked these pixelated icons as we felt they would work well with conveying information on the how to. It also would appeal well to our target audience of students with gaming culture etc.


 Here is the completed aspects of the cocktail book. I think all the icons Ste made are really successful and really work well to convey the personalities of the drink.
I then worked on creating some pieces for our pack...


 I developed the previous designs to make these pages for the drinking games cards, I used the current icons, colour schemes and chosen type to create images that fit with the theme. I feel they work a lot better now the layout is a lot more successful and I like the continued look across the range.
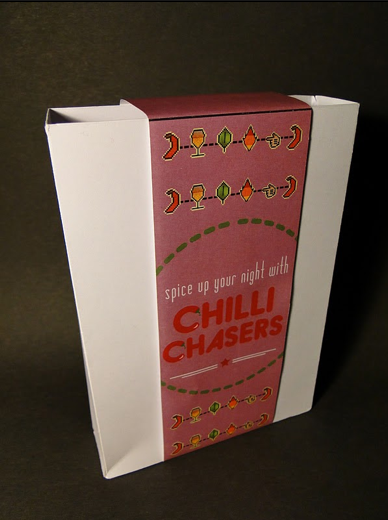
 Finally I created this belly band to be used on the pack itself and for the playing cards.


Here is a poster Ste made as instructions for growing chillies. The steps are brief and simple to make it easy to understand and to keep the attention of the viewer as I don't think the average student would be as interested in a long winded approach.


Here are some information graphics created to fit into the cocktail recipe book, I think they work well as a visual representation as it is easy to gather the needed information from a glance.


I then worked on creating some pieces for our pack...


Here are some initial designs that I put together first of all, I like the separate images that fit with the rules of the game, but I don't like the lists as I feel they don't fit within the composition.


Tuesday, 6 December 2011
How To... Logo Experiments.

Here is my original logo design, I really like the structure and I think there is a good balance with the type sizes which gives a good sense of priority. Although I think the colour needs to be altered as I feel it looks to much like something for an Italian restaurant or on a christmas theme.

I have now changed to an orange, I feel this is more successful because of the connotations with heat.

I have now created some imagery to include. I tried to keep it as simple as possible to fit with the icon theme and to ensure that it wasn't to distracting to the text. I need to experiments with different layouts as I don't like how the chilli goes through the smallest of the text as I think it compromises readability.

I thought it might look better with the image completely separate from the text, although now I think it appears a bit disjointed. Also with how it is positioned it now looks a little top heavy and unbalanced.

Now I have done this arrangement which I think is the most successful. I like how it is being incorporated with the text and still not affecting the communication.


Finally, I have altered my caption type. I feel these looks a lot better aesthetically as it is easier to read and looks better as a composition.
How To... Type Experiments.
Here are some typefaces that I could experiment with. I have gone with sans serif designs that either have a narrow stroke width or narrow in proportion. My favourite is Matchbook, I think it looks really clean and sophisticated and I think the rounded edges give it an interesting quality to help it stand out. I also usually really like Bebas but in this instance I think it looks to bold and blocky.


Saturday, 3 December 2011
How To... Interim Crit.
Again, I found the interim crit for this project really helpful. After talking through our ideas it was suggested that we should maybe find another angle for targeting our audience and find other benefits of growing things to interest them. From this we have now decided to focus our research on growing specifically chillies. Another avenue we will look at is recipes that include them for food and drink. We will continue to produce a pack but now on theme of growing chillies to use in specific drinks to use in specially designed drinking games.

Friday, 2 December 2011
How To... Net Experiments.
Here are some nets created by Tanida, exploring possible ways to present out product...
Net 1:


Net 2:


Thursday, 1 December 2011


How To... Photo's.

Subscribe to:
Comments (Atom)